Learn How Facebook's Optimization Algorithm Works
We've spent a lot of late nights researching and testing what makes Facebook tick. In this lesson, you'll learn a basic model that explains how Facebook's optimization algorithm works. It sounds crazy complicated. It is. But this lesson will break everything down into something WAY more digestible.
In this lesson, we're going to learn about how Facebook is optimizing for your goals in the background as you're running your campaigns. In other words, when you choose your objective for one of your campaigns, it could be traffic, conversions, video views, app installs, or whatever it is, how does Facebook know who to show your ads to? It's a very important question to at least have some understanding about.
Know Enough Technical Details To Get By
A lot of people might say, "I don't need to know the technical side of Facebook. I don't know need to know the details. I just need to know that it works." To some extent, I agree with you. You can run campaigns and you can get leads or you can get sales, but at the end of the day, if you want to have mastery over your campaigns and be able to scale, it's helpful to know some of the context of what's happening in the background.
Take your lawnmower, for instance. You know that it cuts the grass. You know that if you push it out on your yard, the grass will be cut shorter than it is now. But you also know that if you stick your hand underneath the lawnmower when it's actually running, you're going to cut your hand off, you're going to lose a finger or an arm or whatever. There's at least some level of technical knowledge you have about the lawnmower, enough to not lose your hand every time you use the thing out in the yard.

In the same way, we want you to have some basic understanding or some context for what Facebook is doing beneath the surface so that you can have more of a strategic approach as you're trying to scale your campaigns later. A part of what we're going to do here is create a visual model that we're going to keep referring back to later, and so we want to kind of set the stage for that, too.
Just to recap, we're trying to understand how Facebook optimizes for those objectives that you set.
We're surfacing a lot of the experience that we have as an agency. Like we've spent millions of dollars on Facebook, we have our own kind of data and testing that we've done, there's that first-hand experience, but we also believe that it's helpful to look at what Facebook is telling us, even if it's kind of indirect.
Looking at Facebook's Patents for Clues
They're a little bit tight-lipped about how some of this stuff works, but we found that even looking at things like patents, they reveal what Facebook is up to. Like any tech company, Facebook files patents publicly to protect their intellectual property and to protect how they go about serving ads on their social network, for instance. As they're describing how some of this technology works, you can start to draw some conclusions about how things are working underneath the surface and what that means for you as an advertiser.
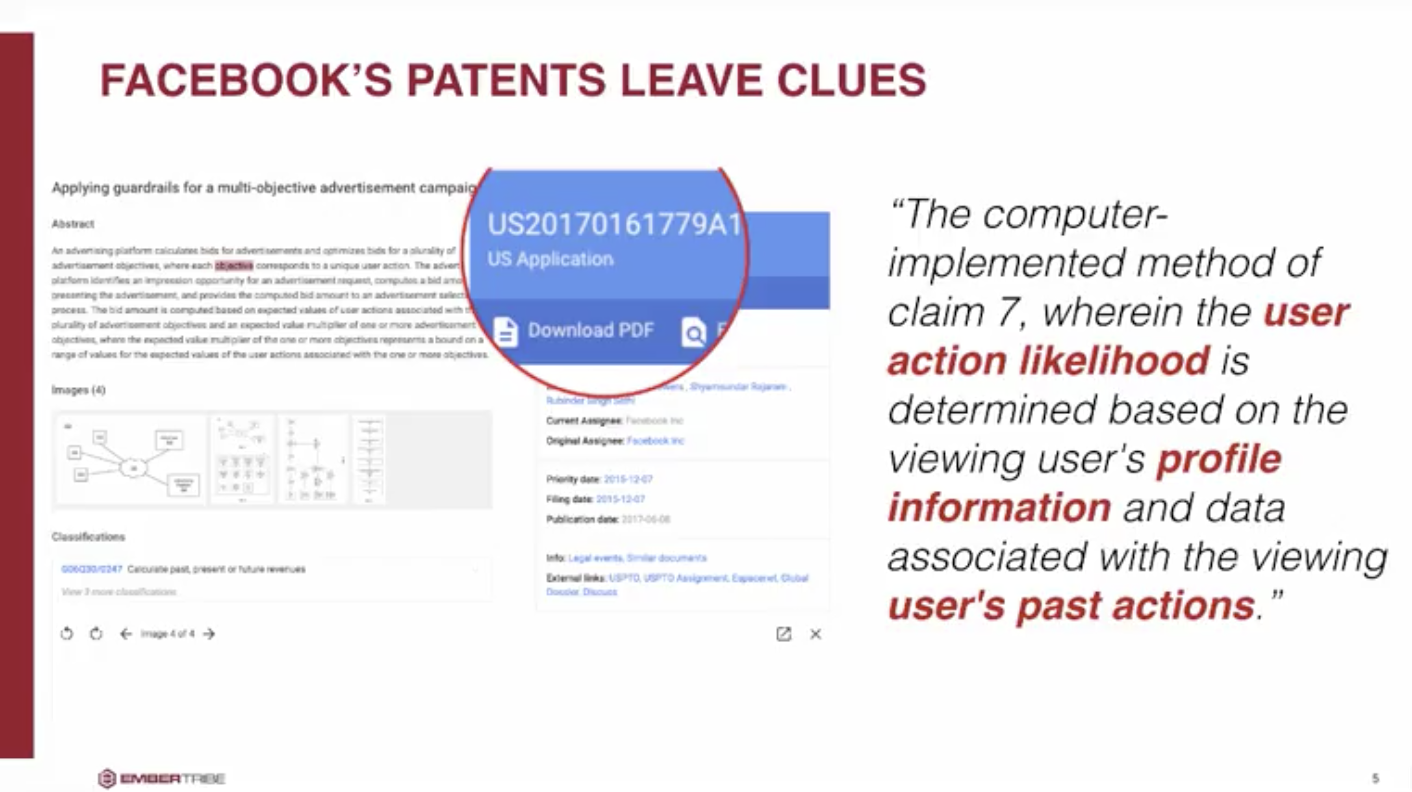
One of those patents is US2017 blah, blah, blah, blah, blah. I'm not going to bore you with all the details, but I did want to surface this one piece of one particular patent that surfaces this concept of a user action likelihood. User action likelihood.
Understanding The User Action Likelihood Score
It's really just a score that Facebook is calculating to understand how people will take certain actions. It's part of an algorithm or part of kind of a calculation here where they're basically telling you, or not telling you, this is working in the background. They're understanding what a person is likely to do on their platform.
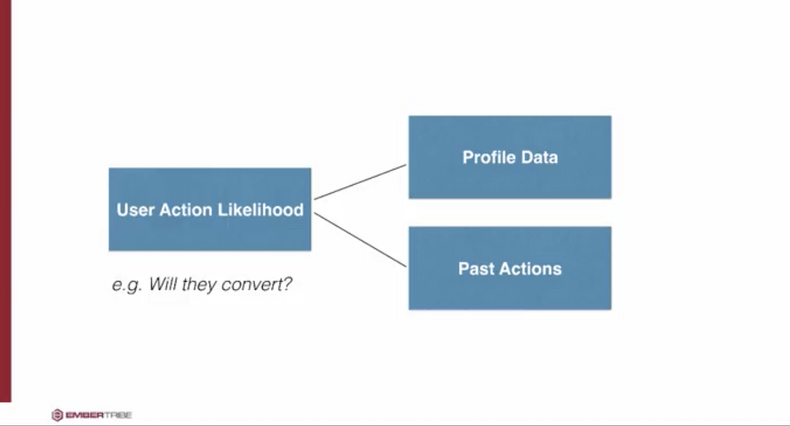
The way that they get that score is by looking at some of the explicit information on your profile, what they know about you as a user, your demographics, your interests, your behaviors, even some of the partner categories that they buy to understand more about maybe your offline behavior. They got stuff about you, and then they have past actions - the actions that you take on Facebook. What types of posts you react to? What you share? What you comment on? Are you clicking on ads? All those behaviors, or actions, are measured and they're factored with what they know about you as a person and blended to create this user action likelihood score. This score is really the basis of a lot of how they're predicting to show your ads or who to show your ads to.
For example, will they convert? Will somebody convert? Well, let's look at their profile data, let's look at their past actions that they've taken on the platform, stitch all these data points together, and then with our algorithm, choose who to show your ad to.
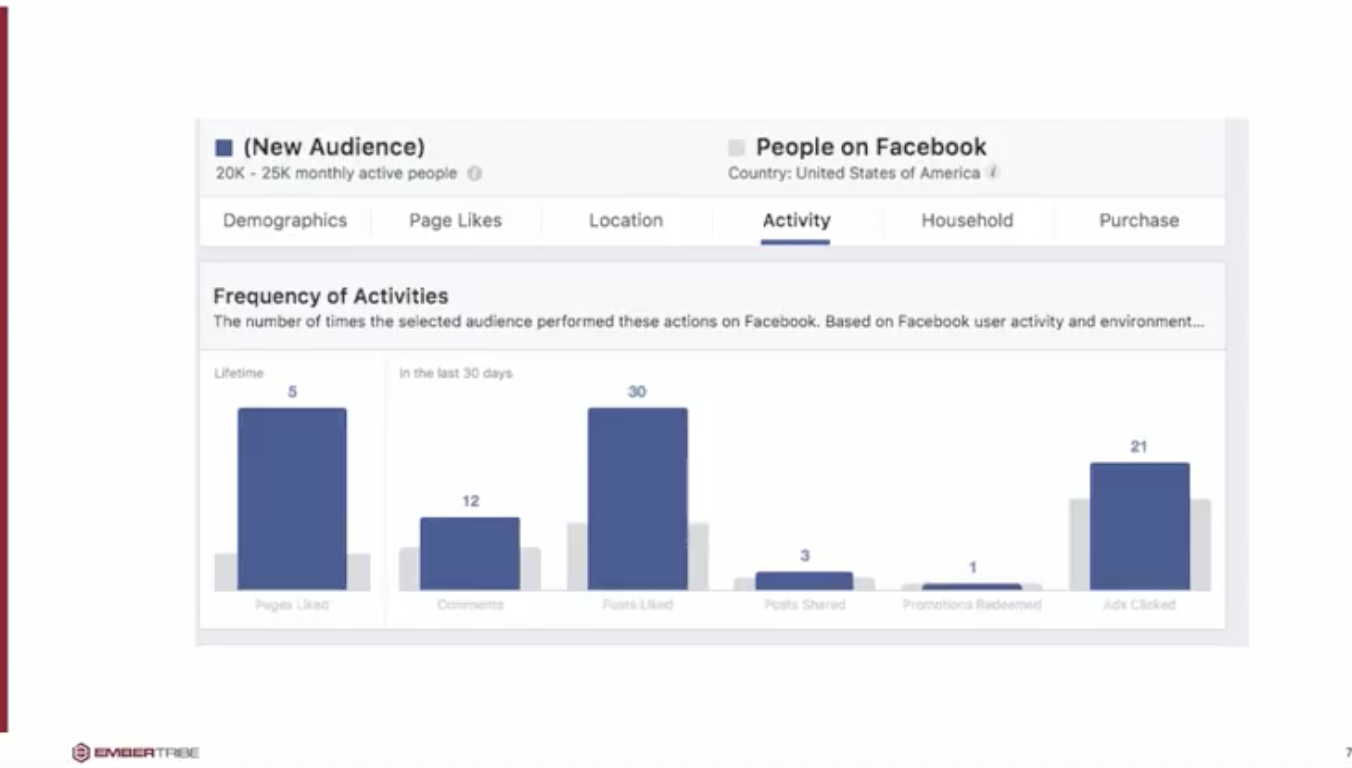
This is actually a shot from the audience insights tool in Facebook. It's one of the research tools they give us. You can see that in this particular audience that we've selected, there's people who like pages more than the rest of Facebook users, or comment, or they're more likely to click on ads. We're getting a peek into that user action likelihood score. It's showing that your actions are tracked and they're actually represented here in the audience insights tool.
A Visual Model to Understand The Facebook Ad Algorithm
I promised that we wanted to create a visual model here, something that we can look back to, something that's going to simplify all this technical jargon into a nice kind of easy model here.
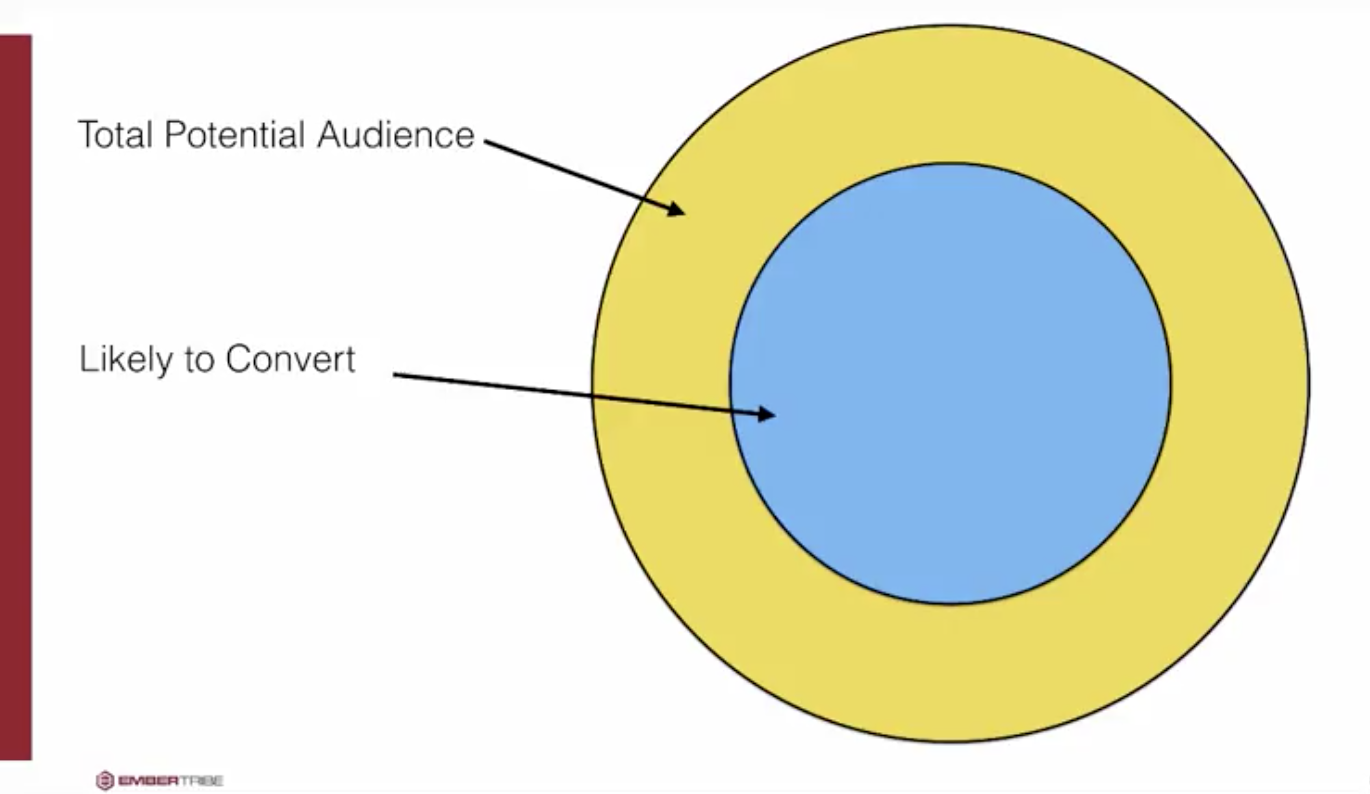
Let's for a second there pretend that you have a product, and this product is a dog chew toy. It's not just any dog chew toy. It's an organic dog chew toy. It's green. It's safe for your pup. You want to run your Facebook ad, and so the first place you stop is maybe the the dog interest, dog lover interests. We want to find pet owners or people who just love pets.
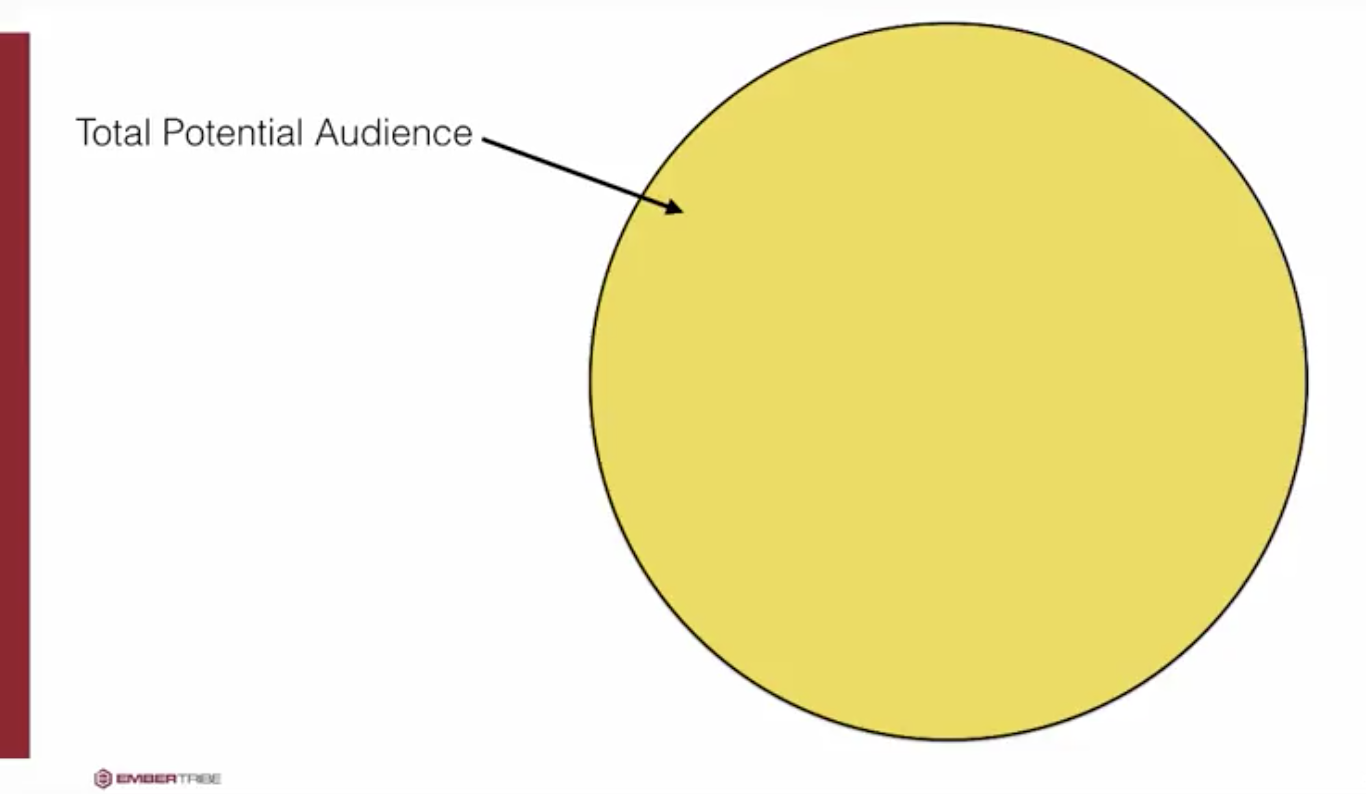
That big yellow circle just represents kind of your total potential audience. Maybe it's in the United States. Let's just say maybe it's like 10 million people. That's your starting point. Let's say you launched this campaign. You're optimizing for the conversions objectives. You want people to purchase the dog chew toy from your store.
Well, as Facebook gets going, as they start gathering data, they're going to find that there's even a narrower segment of people within that total audience that are more likely to convert.
They're more likely to buy this toy. Maybe, for instance, there are 30 to 40-year-old females, maybe that's just more of the sweet spot of where people are buying.
But as Facebook continues to optimize, continues to learn, they find that there's even a more specific segment, a greater sweet spot where people are converting at an even higher rate.
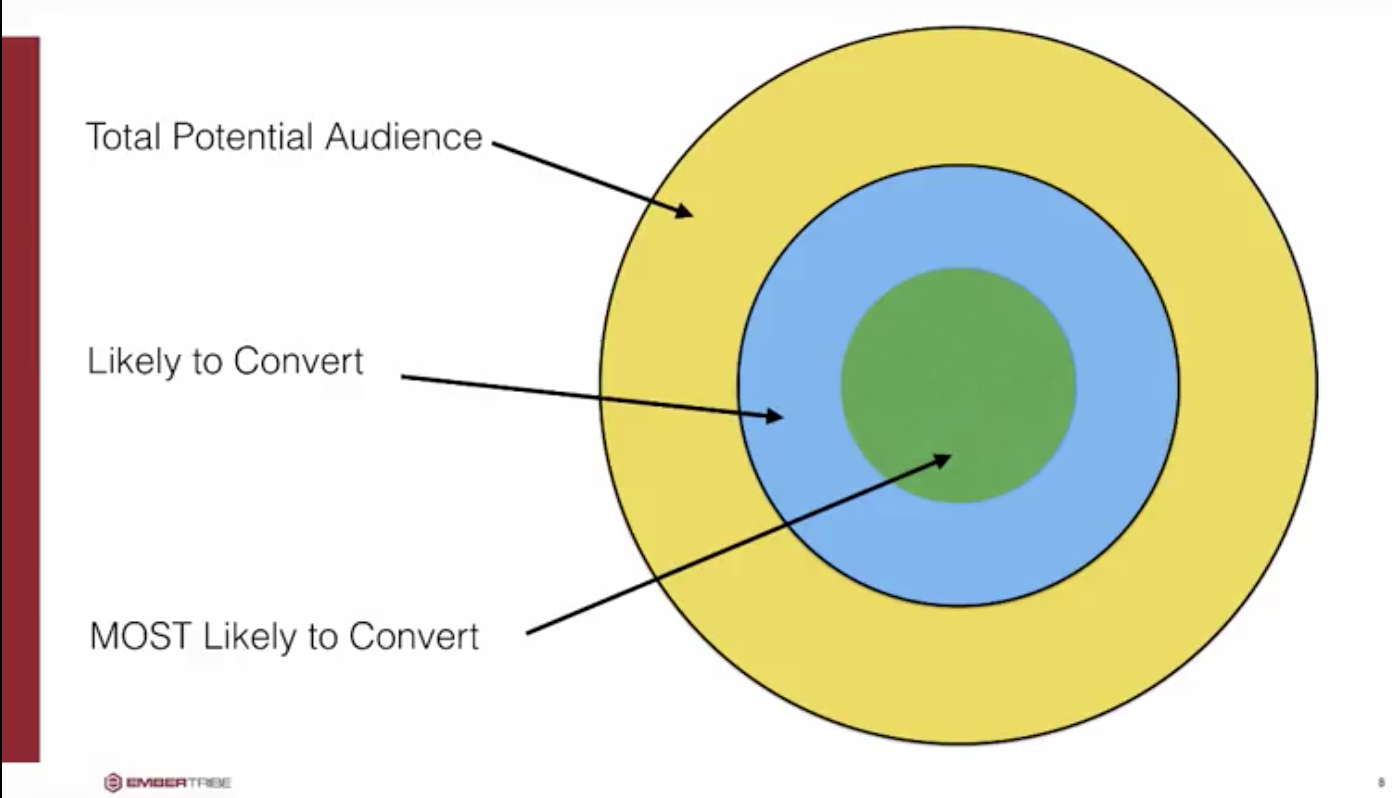
This is really where you want to be. This is where people are buying at the lowest rate, and maybe the the demographics ... again, this is all hypothetical. But maybe it's just not only 30 to 40-year-old females, but maybe 30 to 40-year-old females who also make other green purchases or organic products.
You start to stitch these things together, and Facebook connects the dots, and finds that this green area, representative of your total audience, is where you're going to get the most profitable sales possible.
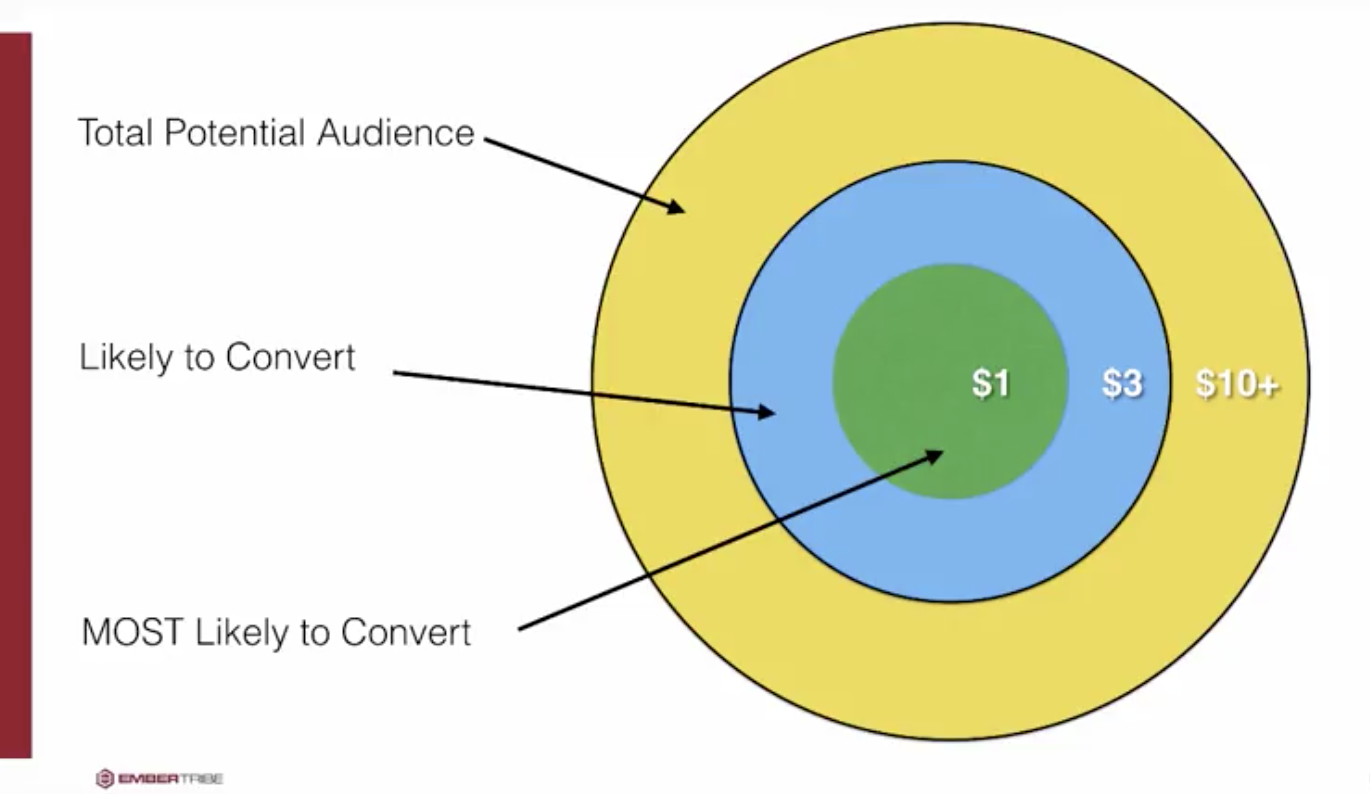
Again, as this is an e-commerce example, let's just use some fake numbers here, but let's just say that these people represent a dollar cost per sale, a dollar CPA.
Then that likely to convert blue circle is going to be a little bit more expensive at three dollars per sale.
Then you can see that maybe in this outer ring, the total audience, they're still going to buy from you, but it's going to take a lot more visibility or it's going to be harder to find those folks, so it's going to be a higher cost per sale. It may be ten bucks a sale.
You can see that there's a kind of out working where Facebook is trying to center, they're trying to identify who are the key people, based on that user action likelihood score that are most likely to take the action to your offer, based on some of the data that they're gathering from your campaign.
Really, what it comes down to is this model, this way of visualizing, has really helped our agency to have a point of reference and understand, for instance, how we should scale budgets or maybe how we should target our audiences. We're going to keep referring back to this in some of the later trainings and use this model of understanding where audiences are kind of in these concentric circles and how they're going to pay off at the end of the day for your campaigns.
Key Takeaways About The Facebook Algorithm
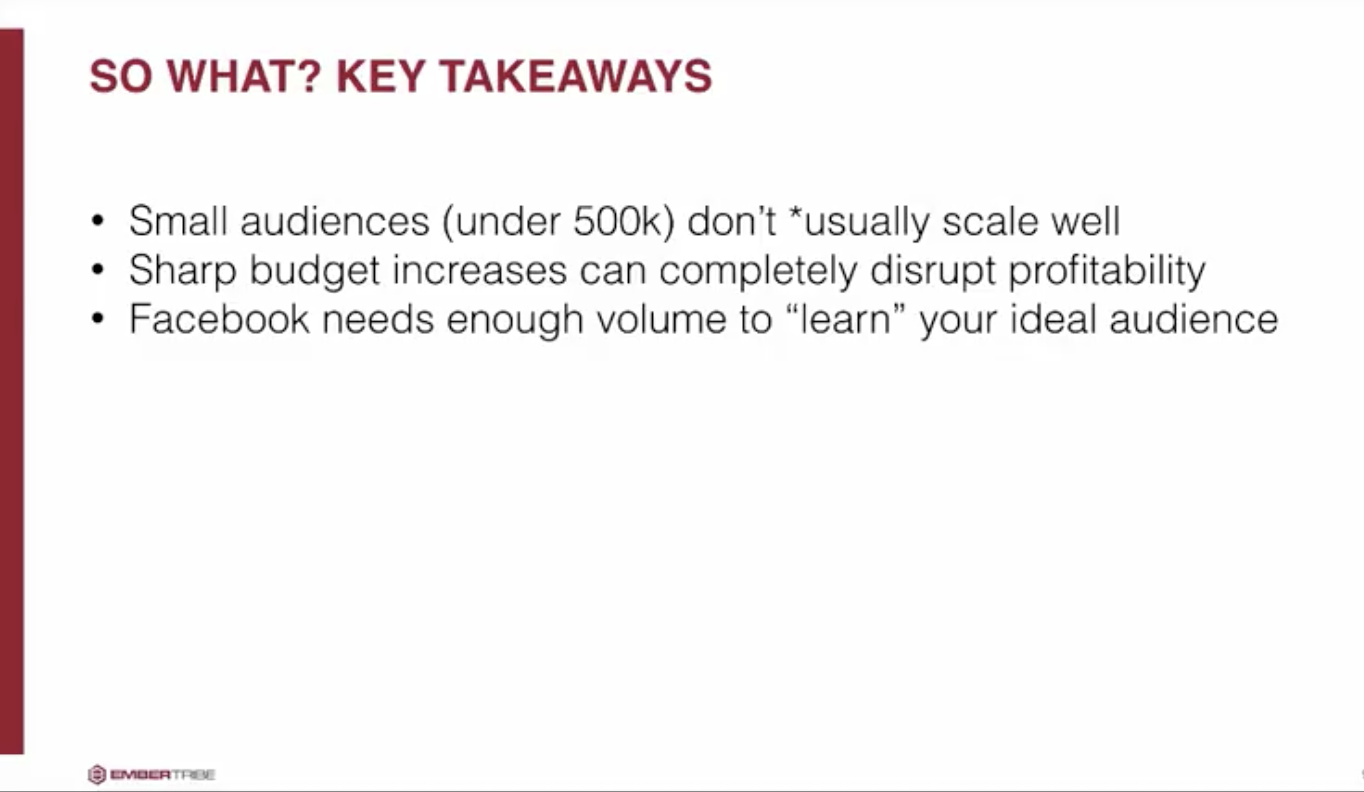
Some key takeaways here include that we found that smaller total audiences, if you have a smaller yellow circle altogether, it doesn't usually scale that well. This is just kind of a round number, but under 500,000, under half a million, it doesn't really scale as far as you'd like because you're running out of not only sweet spots, but just total audience reach.
Now, I usually put an asterisk there because it's not always the case. If you sell a really high ticket item, you may not need as much reach or as big of an audience, so you can still scale. But on the whole, just take this as a rule of thumb, that the smaller audiences won't typically scale as well. You're not giving the algorithm enough room to find that sweet spot of people.
Also, what we'll find and we'll explore this in more depth, that sharp budget increases, really sudden changes, if you find something that's working, you jack up the budgets real quick, it can completely throw off your profitability of your campaigns. If you were maybe in that green circle, that sweet spot, and suddenly you got excited and you raised your budgets, now Facebook is starting to pull into the yellow and pull into the blue, and they're not centered, they're not able to figure out who that sweet spot is right away. It takes time for them to recenter. In the meantime, you're suffering. Your cost per sale is much higher.
Lastly, we understand that Facebook needs volume. Facebook is probably the best student in the world, if you put it that way. They need the volume, they need the reps to learn who the right people are. You need to feed them that data over enough time and with enough budget for them to learn what those sweet spots are and then move out from there.
A few rules of thumb here that we're going to keep referring back to this model as we dive in some of the other trainings, just keep in mind that this is kind of a model that we've created out of our own experience, but also from some of the technical clues that Facebook has left behind in their documentation and in their patents.

